PCOSBase Manual
Site Organization
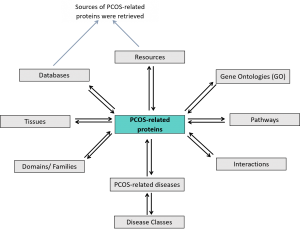
Figure 1: The structure of PCOSBase
The structure of PCOSBase in Figure 1 shows the integration of the tables entry. The main table of PCOSBase is a PCOS-related proteins table, where 8,185 proteins are listed. The grey-coloured boxes are the tables that described PCOS-related proteins entity (i.e: Interactions, Domains, Pathways, Resources, etc).
The GO table contains GO classification (biological processes, cellular compartments, molecular functions) of the proteins.
Pathways table listed all pathways which PCOS-related proteins were involved in.
Interactions table recorded all interactions (PPI) between PCOS-related proteins. The interactions were retrieved from Human Integrated Protein-Protein Interaction rEference (HIPPIE) database.
PCOS-related diseases table itemized all diseases associated with PCOS-related proteins. The data were obtained from DisGeNET database. Diseases vocabulary in PCOSBase used Unified Medical Language System® (UMLS®). UMLS® Methathesaurus® concept structure were used to map the for every UMLS Concept Unique Identifiers (CUIs) Medical Subject Headings (MeSH) terms. UMLS CUIs were converted into MeSH terms to classify the disease based on MeSH tree. Thus, the disease class tables in PCOSBase were complied to the classification system used in MeSH database.
Domains table listed all domains that present in PCOS-related proteins.
Tissues table contains list of tissues and specific cell type of all PCOS-related proteins expressed in normal condition.
The Databases and Resources tables cataloged all databases and articles, where PCOS-related proteins were retrieved from. The Resources table consists of transcriptomics and proteomics articles.
Search Box
Every page in PCOSBase has a search box utility (also carries simple search function). It can be used to search for protein, GO, pathway, disease, domain and tissue to match a particular keyword. User can also search PCOSBase using specific ID (as follow) or any keyword.
- Entrez Gene ID
- Uniprot ID
- Gene symbol
- GO ID or GO term
- Pathway ID or pathway term
- Interpro ID or InterPro term
- UMLS® CUI, MeSH ID or disease term
- Tissue
- Keyword, e.g. androgen.
Figure 2 shows the page of PCOSBase with the ‘androgen’ keyword as input in the search box. Once the ‘androgen’ keyword is searched, all entries in the datasets that contain ‘androgen’ word in them will appear.
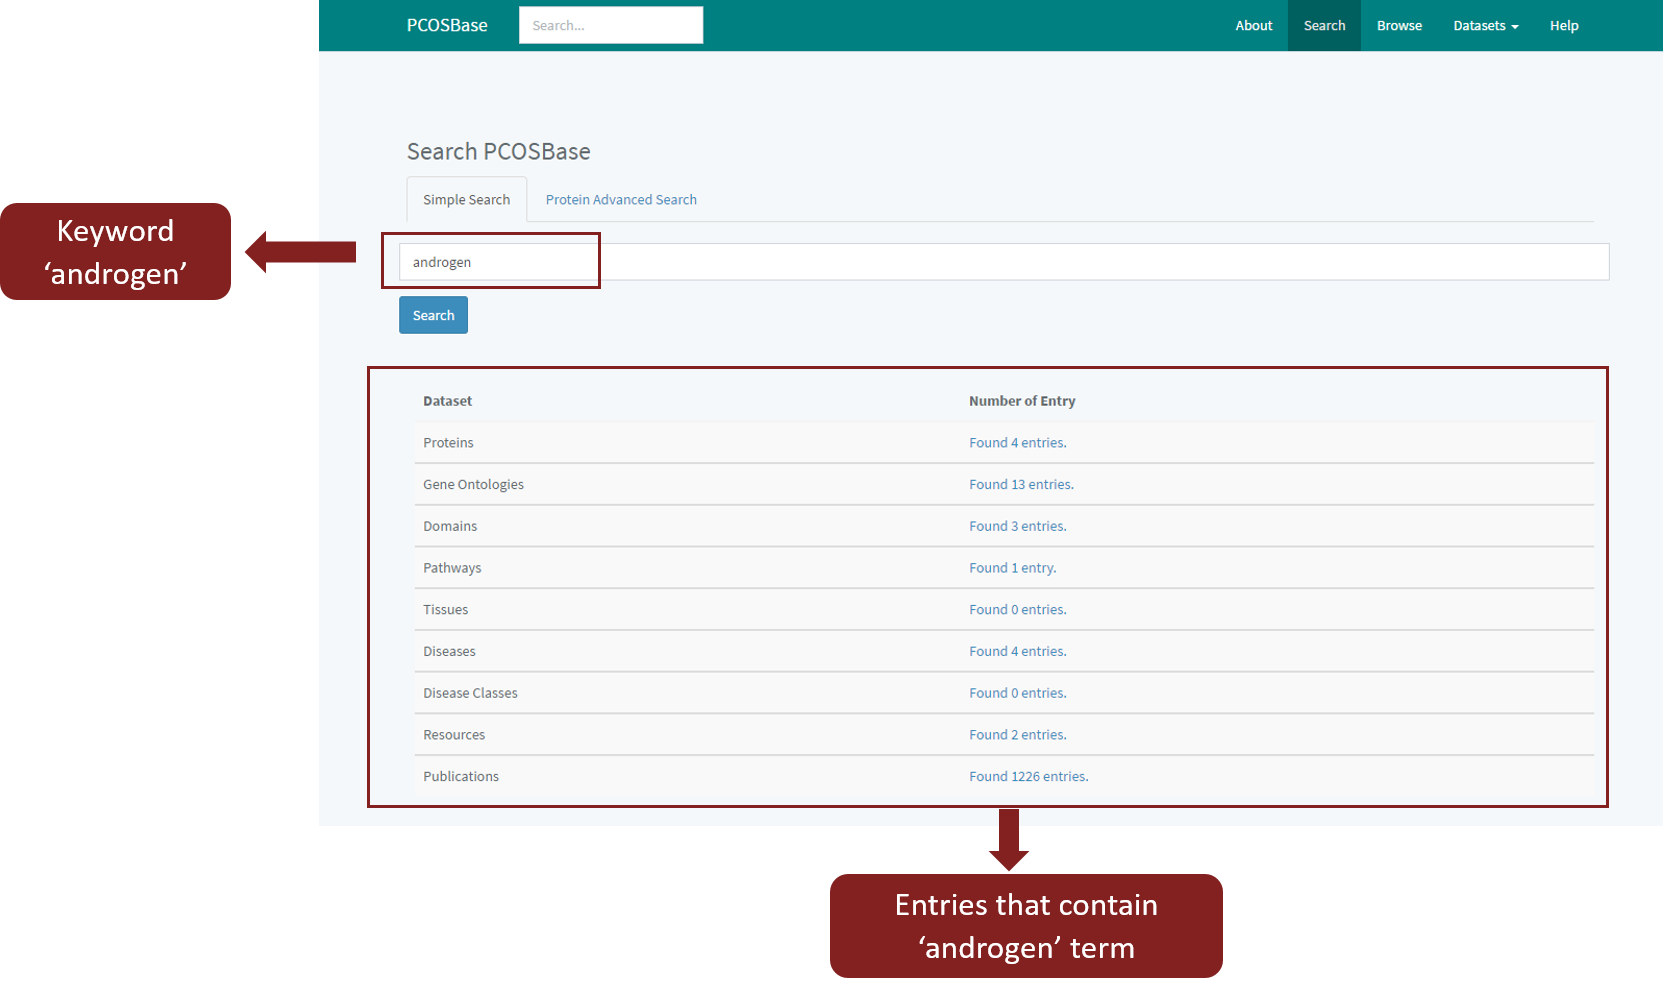 Figure 2 Output of ‘androgen’ keyword
Protein Advanced Search
Search tab contains Simple Search and Protein Advanced Search. You can use the search box on the homepage, in the page header or simple search in the Search tab (Figure 3).
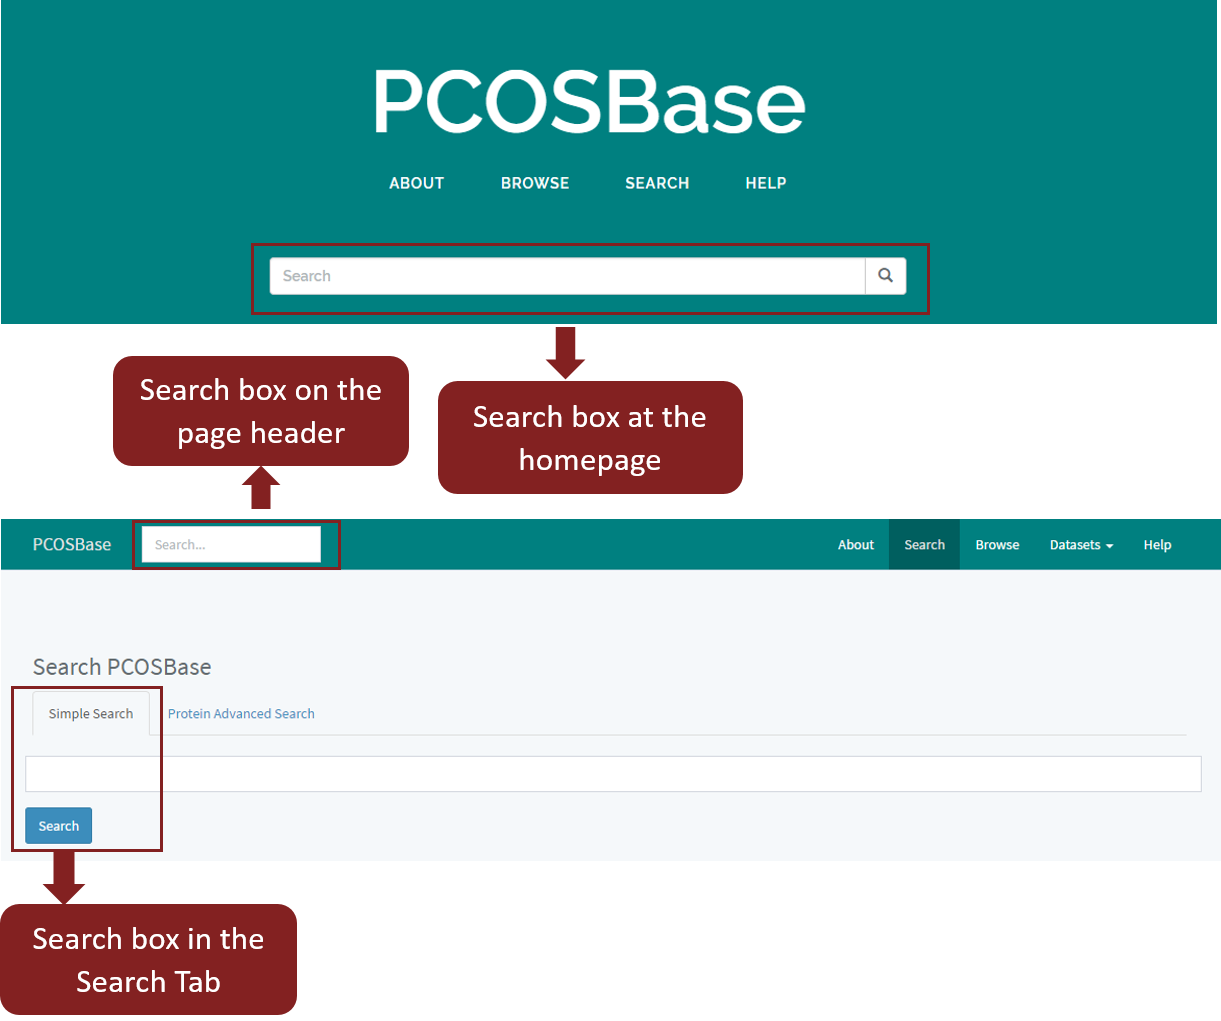
Figure 3: Search boxes in PCOSBase
Protein Advanced Search allows you to retrieve the protein(s) with a particular combination of datasets (e.g. protein(s) associated with both GO term of ‘single fertilization’ and disease of ‘female infertility’), as shown in Figure 4. Protein Advanced Search allows you to find protein(s) that contain specific combination from six different fields (protein descriptions, ontology, pathway, domain/family, tissue and disease).
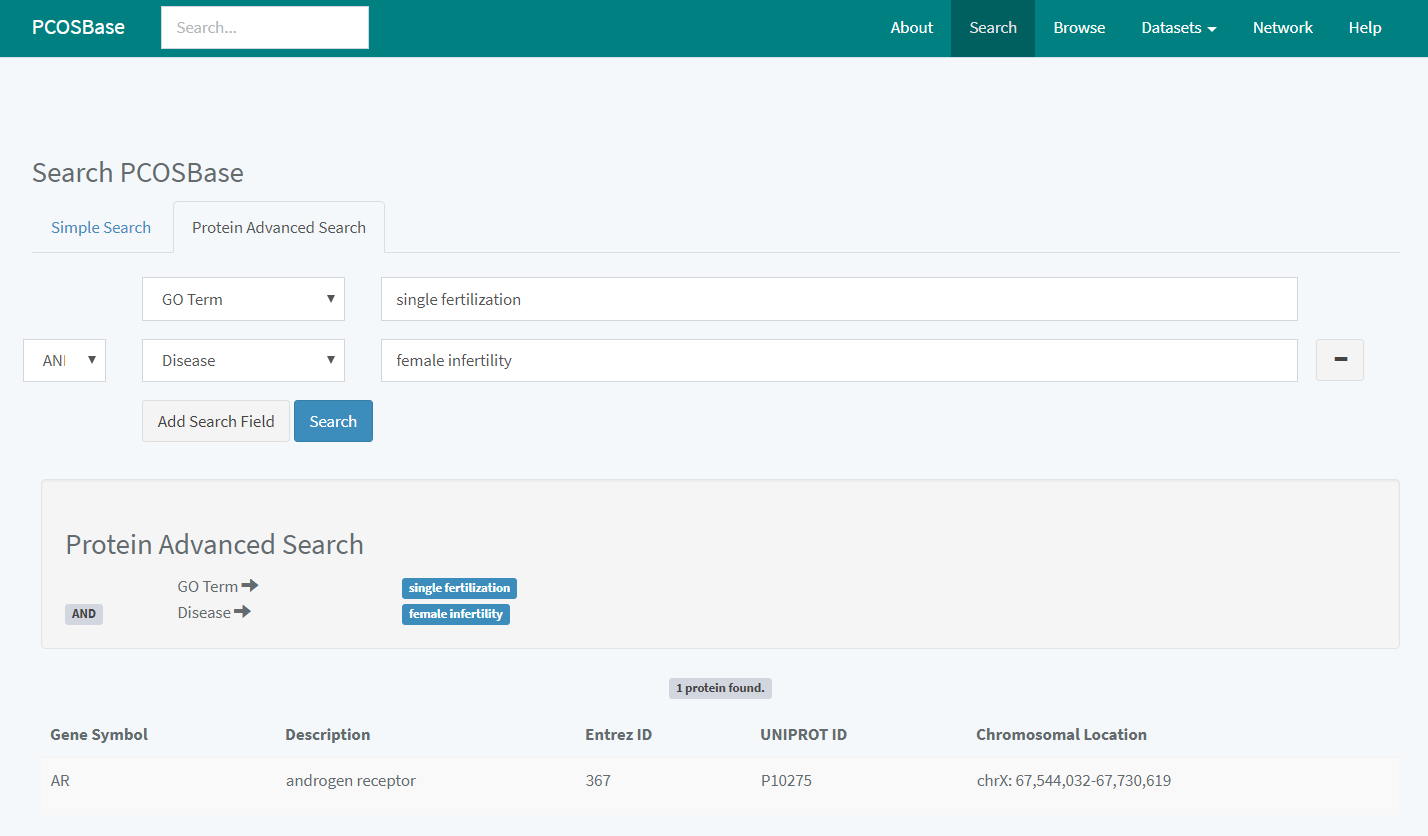 Figure 4: Protein advanced search and the output
Browse Tab
Browse page will appear after clicking the Browse tab on the homepage or at the top right navigation. It shows list of dataset tables for PCOSBase, i.e. PCOS-related Proteins, Gene Ontology (Biological Processes, Cellular Components and Molecular Functions), Pathways, Interactions, Domains, Tissues, Databases, Resources, Publications and PCOS-related Diseases (all classes of disease). Brief explanation for each dataset was included.
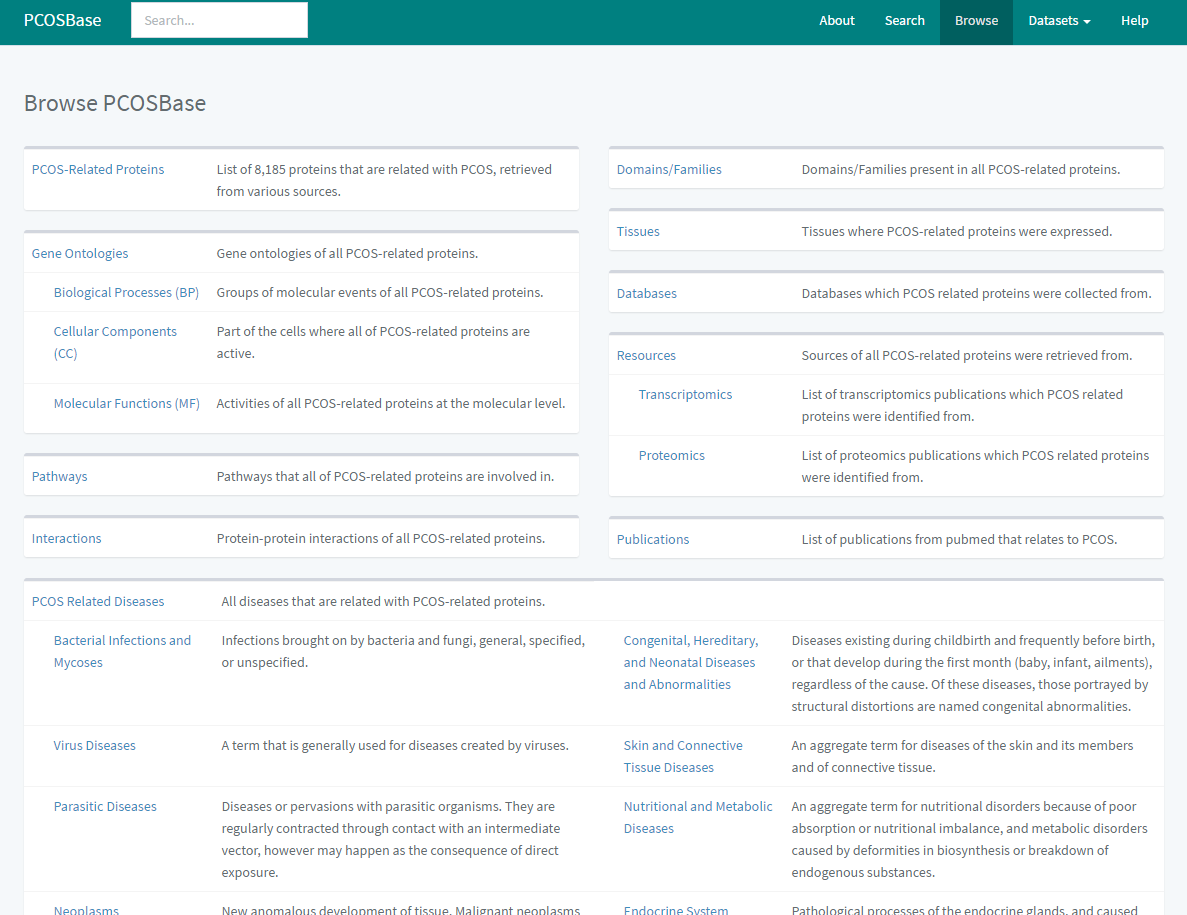 Figure 5: List of datasets and their description in Browse Tab
When you click on the text of any datasets, a list of clicked dataset will be visible. Figure 6 is the example view after clicking on PCOS-Related Proteins.
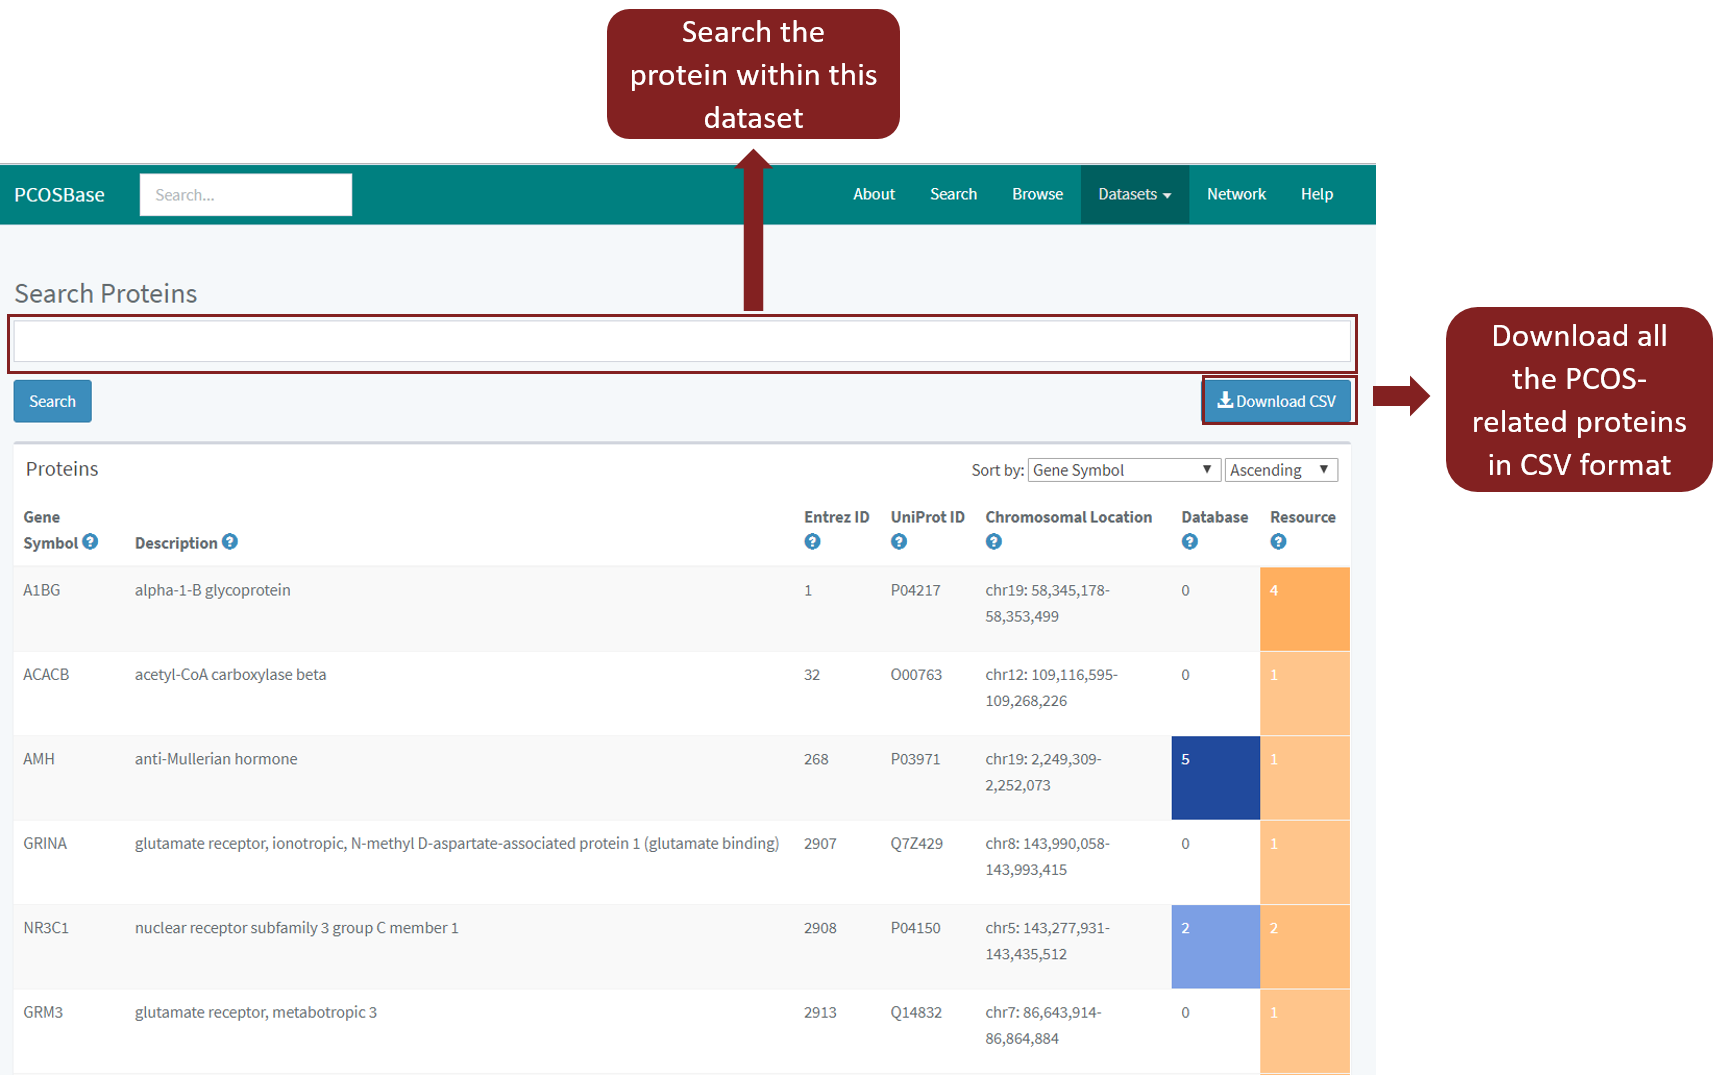
Figure 6: The view of PCOS-Related Proteins
Datasets Tab
Datasets tab is placed at the top right navigation of PCOSBase. It contains all datasets of PCOSBase. Datasets allow you to select and quickly redirect to your desired dataset page. Whilst, Browse tab will navigate you to the Browse page (contain a brief description of each dataset) first, then only you can click on the respective datasets.
Entry Details
This section briefly explained the attributes that are provided when you click on any entries in the tables. For example, if you click on any proteins from Figure 2 and Figure 6, the description of the protein will be shown (Figure 7). All information including Gene Ontology (BP, MF, CC), Domains, Pathways, Diseases, Tissues, Protein Partners, Databases and Resources related to protein (AR) will appear on the separated tabs below the description. These tabs are clickable and contain related data information. List of diseases related to AR will be shown after you click on the disease tab. The same goes to other tabs. The number that shows in every tab represents the statistics of the data related to AR. There are 77 Gene Ontologies, 11 Domains/Families, 11 Pathways, 23 Diseases, 2 Tissues, 330 Protein Partners and 0 Resources that are associated with AR.
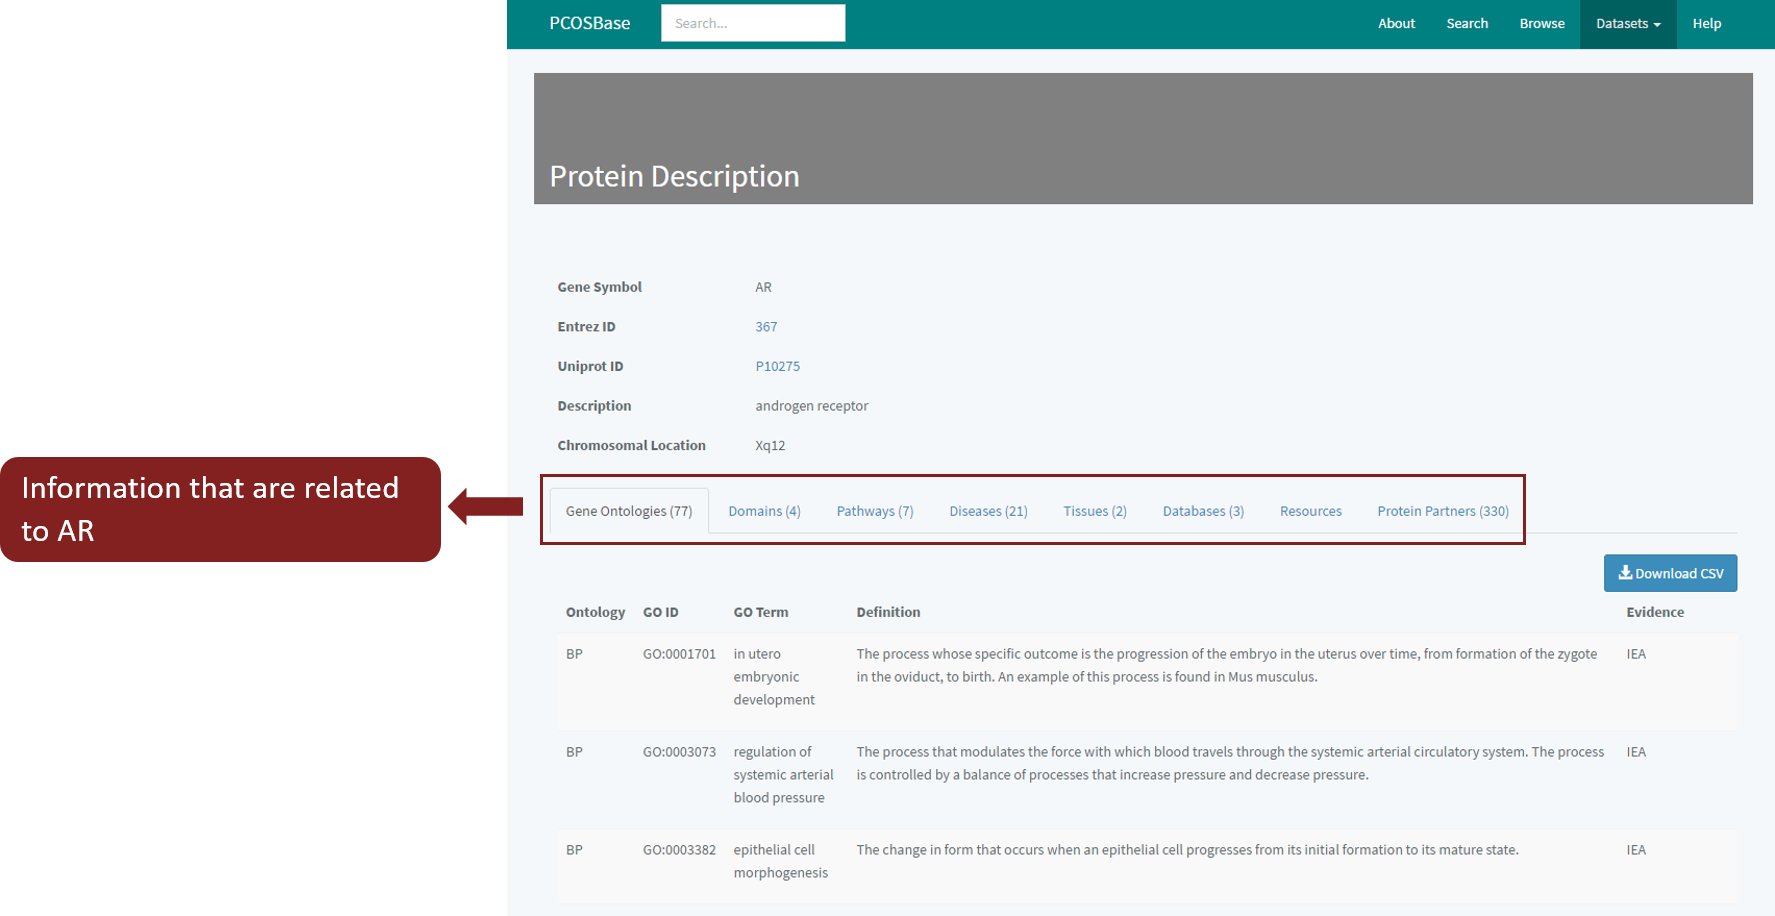
Figure 7: Protein Description of protein ‘androgen receptor’
Every data in every column of each tab is clickable. For example, if you click on ‘GO:0001701’, it will redirect to the description of the respective ontology (Figure 8). List of PCOS-related proteins that are associated with this ontology (GO:0001701) will be shown.
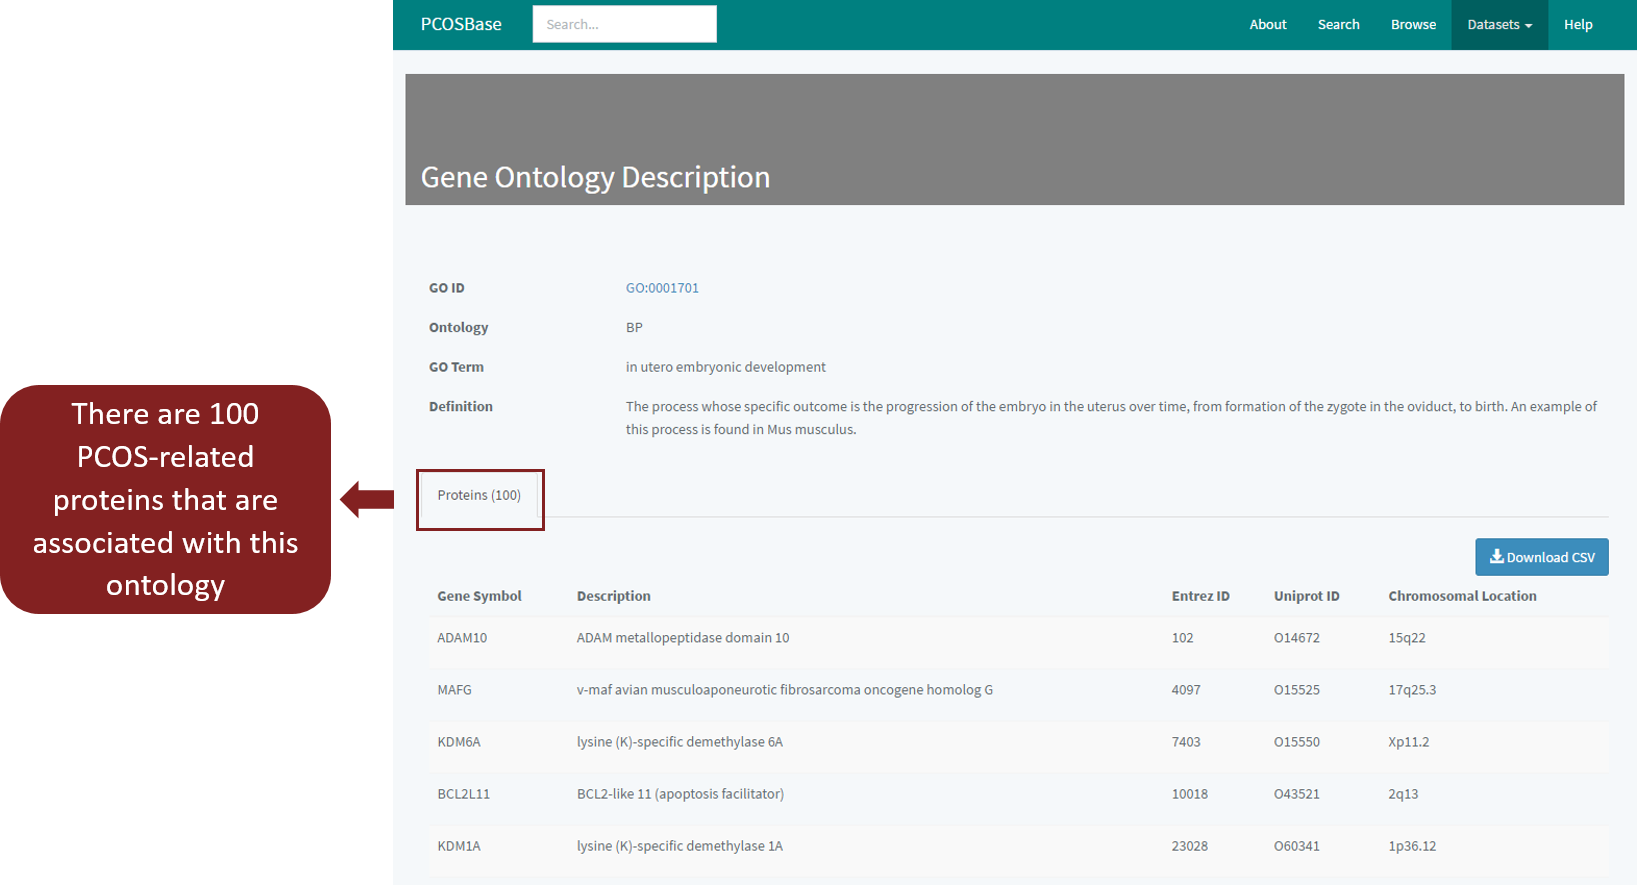
Figure 8: Gene Ontology Description of GO:0001701